01
Data Ontology
Decision Infrastructure purpose-built for high-consequence enterprise decisions. Grounded in causality, context, and memory, so every decision gets faster, sharper, and smarter than the last.


 Recognized by NVIDIA as an AI Startup to watch out for
The Platform
DecisionX connects your data, domain knowledge, and decision history into a living causal model, then reasons through it to give you a decision, not just an answer.

Every decision runs on four capabilities working together - from live signal to board-ready narrative.

Internal systems and external market data, fused into one continuously updating context.
Explore Signals
Root-cause analysis and forecasting grounded in cause and effect, not correlation.
Explore Reasoning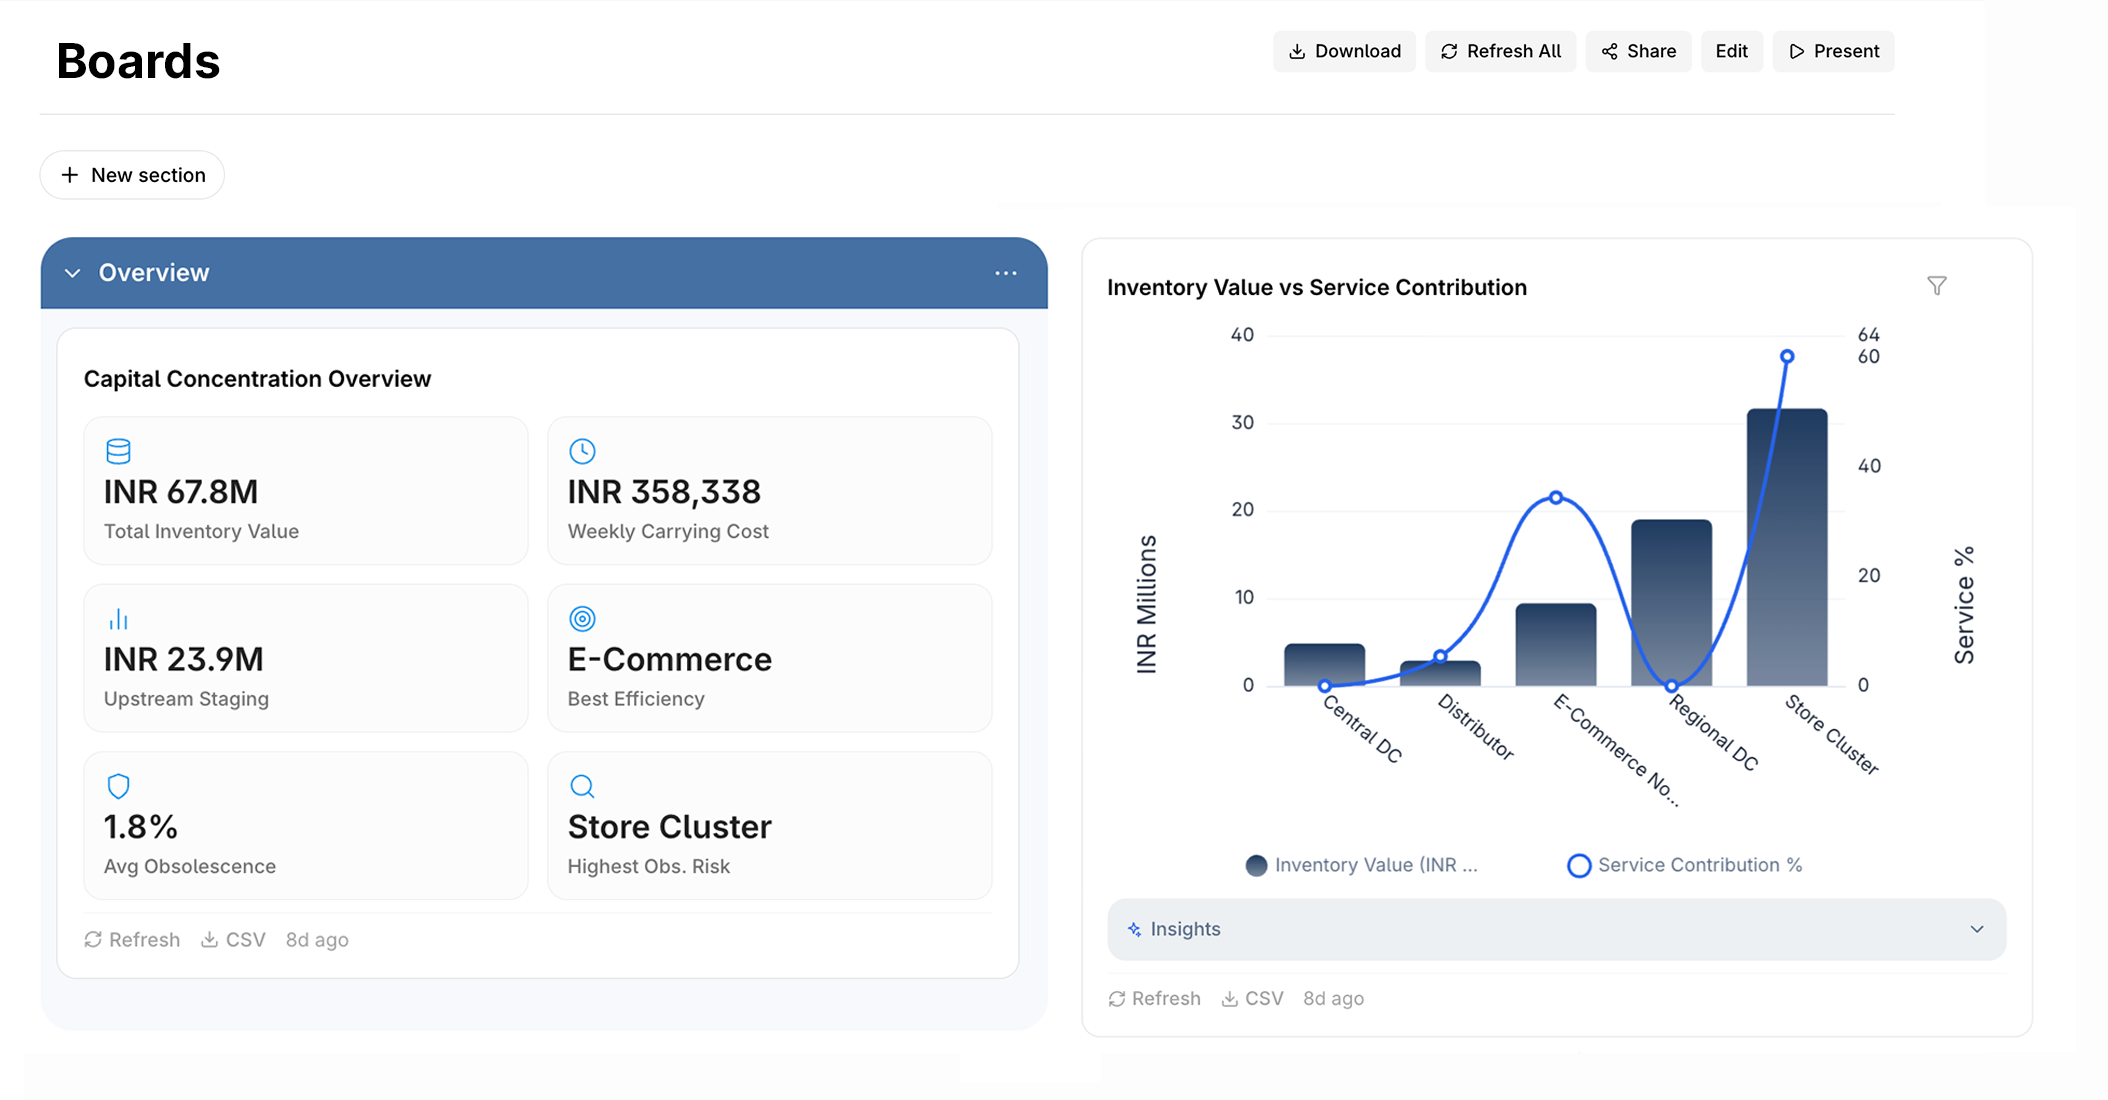
Every decision captured in one place, tracked over time, and compounding into institutional memory.
Explore Boards
Board-ready analysis and narratives generated on demand, sourced straight from live decisions.
Explore Reports