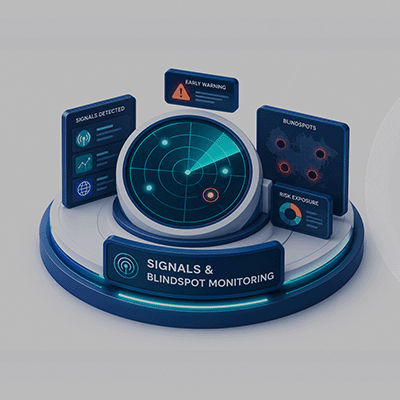
Most problems that catch a leadership team off guard were visible in the data weeks before they became a crisis. The early warning signals were there , in the CRM, the ops system, a competitor announcement, a slowly declining metric. The strategic blindspot was not a missing data point. It was a missing system for surfacing what the data meant, connecting it across functions, and routing it to the decision before it was too late. That gap , between when something starts compounding and when it reaches the people who need to act on it , is what Signals & Blindspot Monitoring is designed to close.
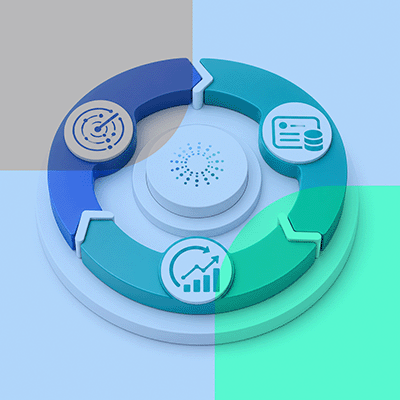
Signals & Blindspot Monitoring is Step 1 of the Decision Lifecycle , the step that answers: what do we need to see before we decide? Without it, every other step is working from an incomplete or outdated picture. With it, the strategy team walks into every decision with a current, cross-functional view of what is changing and what it means for the choices ahead.
Picture a quarterly strategy review. The Chief of Staff has spent the two weeks before it moving between the CRM, the finance system, the ops dashboard, and Slack channels , manually pulling together a view of what is happening across the business. By the time everything is assembled, some of it is already out of date. The leadership team reviews what is in the deck, makes decisions, and moves on.
What is usually not in the deck , not because anyone was careless, but because nobody was looking across all the right systems at once , are the signals that were quietly forming for weeks:
A fulfillment delay that started at 4% six weeks ago is now at 14%. It is sitting in the ops system. Nobody has connected it to the two enterprise deals closing in Q3 that depend on the same fulfillment capacity.
Marketing and Sales are reporting different conversion figures from the same campaign , a 22% gap that has existed for two months. Neither team has flagged it. A budget decision is being made on one version of the truth.
A competitor changed their pricing three weeks ago. It is already showing up in win/loss data. That signal is in the CRM. It has not reached the pricing conversation happening this week.
This is the pattern McKinsey's research quantified: poor situational awareness , not having a current, cross-functional picture before a decision , reduces effective decision speed by up to 40% in organizations that rely on manual context assembly.[1] Salesforce research found that the manual work of assembling that context costs organizations $7.8 million annually in lost productivity, with teams spending up to 12 hours a week just searching for information across different systems.[2] West Monroe puts the downstream effect even more directly: slow decisions cost organizations up to 5% of annual turnover , not from bad strategy, but from decisions that arrived too late or on incomplete context.[3] McKinsey and the Institute of Directors estimate that poor decision quality costs a typical Fortune 500 company $250 million per year in value that is simply never captured.[4]
Definition
Signals & Blindspot Monitoring is the continuous, autonomous process of surfacing early warning signals and strategic blindspots across a business , translating what is changing in internal and external data into what changed, why it changed, and what action to consider next.
Defined and applied to enterprise strategy by Ranjan Kumar, Founder of DecisionX, it is the first step of the Decision Lifecycle , the foundational capability that all subsequent strategic decision-making depends on. It watches continuously across all systems simultaneously , internal operations, cross-functional data, and external market signals , surfaces the patterns that no single team would see on their own, and connects those patterns to the specific decisions currently in play. Its output is a live, prioritized picture of what is changing and where it is relevant , the input that Step 2, Reasoning, works from.
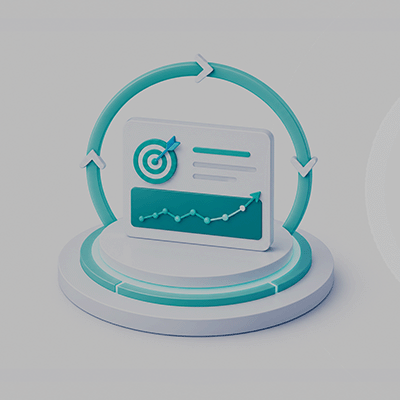
The simplest way to think about the difference: a dashboard tells you what your sales number is today. A signal tells you that your sales number has been declining for three weeks in a specific region, and that it is relevant to the pricing decision you are making on Friday. A dashboard requires someone to notice, connect the dots, and escalate. A signal does that work automatically.
Blindspot monitoring is the harder half. Most things that reach the strategy team do so because someone noticed and escalated them. Blindspots are the things that do not get noticed , not because they are hidden, but because they sit across functional boundaries, move slowly enough to avoid any single alarm threshold, or exist in a system that no one is actively watching against the decisions in play. Blindspot monitoring is specifically designed to catch these.
Signals & Blindspot Monitoring is not one thing. It has three distinct jobs, each addressing a different gap in how leadership teams currently build their picture before a decision.
Every function in a business generates data. Sales has the pipeline. Finance has the numbers. Operations has the throughput metrics. Product has the usage data. The problem is that each team reads their own data , and nobody is reading across all of them at once, connected to the decisions in play.
Internal signal detection does that continuously. It watches for changes that are meaningful not just within a function but in the context of what the business is deciding , so that a fulfillment constraint surfaces before it affects a deal, and a retention dip surfaces before it affects a revenue forecast.
Decisions are built on assumptions about the world outside the business , how competitors will behave, what regulation will allow, what customers will pay, how the macro environment will move. Those assumptions can shift between the time a decision is made and the time it plays out. The question is whether the shift is caught early enough to respond , or discovered when the results arrive.
External signal monitoring watches the competitive, regulatory, macroeconomic, and market environment continuously , not as a news feed, but specifically against the assumptions embedded in the decisions currently in play.
Surfacing signals is not enough if the result is a flood of information the strategy team has to sort through before every meeting. Signal-to-decision routing filters what is moving in the environment down to what is actually relevant to the decisions being made this week , connecting each signal to the specific commitment it affects and explaining why it matters. Its output is what feeds directly into Step 2, Reasoning.
Here is the same quarterly channel allocation decision in a scaling consumer brand, played out two ways. Same team, same data, same market. The only difference is whether Signals & Blindspot Monitoring is in place before the decision is made.
The strategy team builds their quarterly channel allocation from a deck assembled over two weeks , last month's campaign numbers, the latest pipeline report, a competitive summary from marketing. Three things are not in the deck: a 19% drop in organic search intent that has been building for seven weeks; a competitor's new trade terms that are already showing up in distributor data; and a pricing gap between the direct channel and the marketplace that has been growing for six weeks. The decision is made. Eight weeks later, results come in below forecast. The post-mortem finds all three issues. They were all visible before the decision was made.
Before the decision meeting, the strategy team has already received a signal brief tied specifically to this decision. The organic search decline is surfaced and connected to the direct channel model. The competitor's trade terms are flagged against the distribution assumptions in the current plan. The pricing discrepancy is identified as a cross-team data gap that will distort how results get interpreted. The team walks in with the current picture. The allocation is adjusted before it is finalised. The assumptions are named. Step 2 , Reasoning , starts from a shared, up-to-date foundation rather than a partially stale deck.
The difference is not just a better outcome in this one quarter. It is a shift in how the team operates , from discovering problems after the fact to seeing them before the commitment. That shift, repeated across every decision cycle, is what compounds.
Step 1 is the entry point. Everything downstream depends on what it surfaces. Without a current, cross-functional picture of what is changing, Step 2 , Reasoning , is working from whatever was in last week's deck. With it, Reasoning starts from a live foundation and moves directly to structured thinking about what to do.
↑ Institutional learning from Step 5 feeds back into how signals are read in Step 1 , the feedback loop that turns a pipeline into compounding infrastructure.
There is also a feedback loop that makes this step sharper over time. Step 5 , Learn & Compound , identifies which signals actually mattered to which decisions and which turned out to be noise. That learning feeds back into Step 1 , tightening the signal-to-decision routing, improving what gets watched, and progressively shortening the gap between when something first appears and when it reaches the people who need to act on it.
Most tools show you what changed. A metric went up. A metric went down. You are left to figure out the rest.
DecisionX approaches this differently. Instead of presenting numbers, it reads across your business , across functions, across internal data, and across external signals , using causal AI that understands how the different parts of your business connect to each other. The output is not a chart. It is a briefing.
Every signal DecisionX surfaces comes with three components , what changed, why it changed, and a suggested next best action. Together, these three replace the manual detective work that strategy teams currently do before every major decision:
A plain-language summary of the change , what moved, by how much, and across which part of the business or market. No jargon. No data dumps. Just a clear statement of what is different from before.
This is where causal understanding matters. Rather than listing correlated metrics, DecisionX traces the likely cause , connecting the change to the internal or external factor that drove it. This is the part that most tools skip, leaving the strategy team to form their own hypothesis in a meeting room.
Not a recommendation to click on. A structured suggestion for what the strategy or business team should consider doing , specific enough to be actionable, clear enough to be immediately useful in a decision conversation.
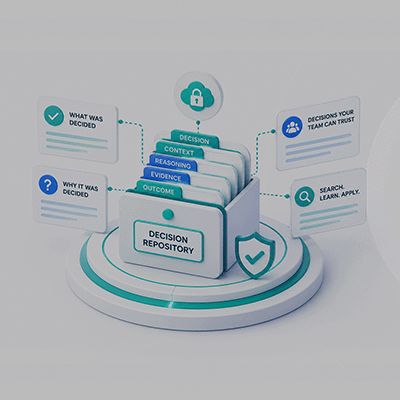
A Chief of Staff or Head of Strategy walks into every important meeting already briefed , not on what the dashboards showed last week, but on what is changing now, why it is changing, and what to consider before the decision is made.
About this series
The Decision Lifecycle Feature Series maps the five steps that connect a strategic signal to institutional learning. Developed by Ranjan Kumar at DecisionX.
Step 1 , Signals & Blindspot Monitoring (this article) · Step 2 , Reasoning · Step 3 , Decision as Object · Step 4 , Track · Step 5 , Learn & Compound
Companion reading: the Decision Made ≠ Decision Done industry series , where the post-decision gap costs CPG, Manufacturing, Pharma, India D2C.


Ranjan Kumar is the Founder and CEO of DecisionX AI, the world’s first self-learning, context-aware Decision Intelligence platform that enables enterprises to make smarter, faster business decisions through agentic AI. A serial entrepreneur and three-time founder with over 17 years of experience, Ranjan previously built Entropik, the world’s first Emotion AI platform with 17 global patent claims. An IIT Kharagpur alumnus, he is widely recognized as a thought leader in enterprise AI, Ontology Engineering, decision reasoning, and AI-driven business transformation.